Tutorial: //////////////////////////////////////////////////////////////////////////////////////
https://artixel.wordpress.com/2012/10/09/creating-and-rendering-charts-in-maya-mov/
Tutorial: //////////////////////////////////////////////////////////////////////////////////////
Updates:
*1.0.1.0
*200 Frames Bug Resolved
MT Chart Design Version 1.0.0.0
MT Chart Design Version 1.0.1.0
MT Chart Design Version 2.0.0.0
*first_to_end animation added
MT Chart Design Version 2.2.0.0
*A custom frame range number is added
*datapoints are now driven by upLimit value
Animating and Designing Charts for various purposes now is possible
with one click and several simple settings. You may
render them with high quality shading to boost the
beautiness of your final production.
Instructions:
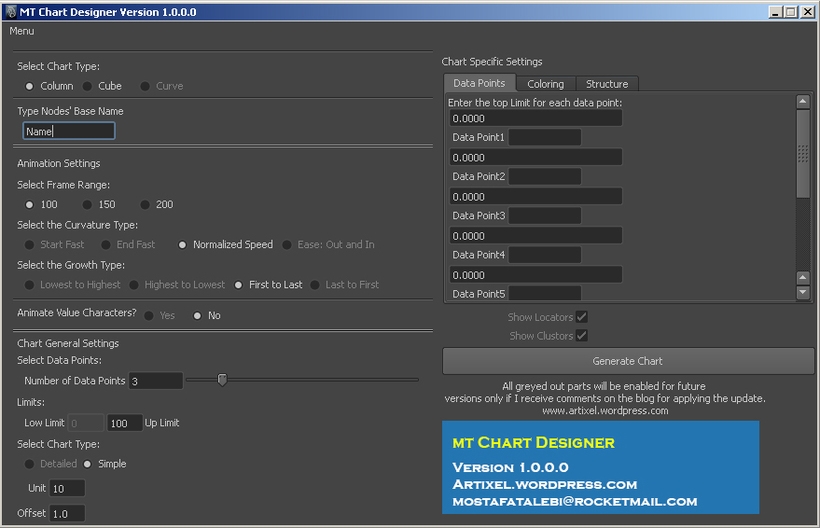
Chart Type:
Column would make for each data point a column, and cube
would do so with cube instead of the column. A curve type would be enabled
in future, however if I receive comments requesting this to make
myself sure that updates are welcomed.
Name: A namefield is used to allow users to keep a name for all of
their created nodes.
Frame Range: Since one of the principal usage of this script is to make
the Datas grow over time, frame-limits are presented for the user to choose
from.
Number Of Data Points are the number of statical columns/cubes you need.
Up Limit: As the name is explanatory, it is used for vertical limit of the chart.
Unit: After how many value a number must be used for vertical range. Try to use
numbers greater than 10. Still all numbers are possible.
Offset: Next to vertical bar, numbers are used with markers, this number set the space
between numbers and the vertical bar.
Data Points: Entering a number for your respective data point.The value entered must
be less than Up Limit number, otherwise process might malfunction.
For each data point a name field is used for making the appropriate
textual representation.
Under the structure tab there are several options:
Range Value Text Scale: Scale of the number next to the vertical bars.
Spacing: Space between various data points, changing this option affects on the whole chart. Use this option to make your chart desirable.
Base Final Offset: The space from the last data point to the end of base platform.
Range Bar Thickness: The thickness of the vertical bar.
Base Platform Thickness: The thickness for the base platform.
Data Point Scale: Scale for the columns and Cubes.
Data Text Scale: Scale of the texts below each individual data point, retrieved from UI.
Data Text Z Offset: The Z translation of each created Data Text.
Please use the Feature Requests to give me ideas.
Please use the Support Forum if you have any questions or problems.
Please rate and review in the Review section.


